


")


MasterMind TCU & TCD Display Options
To access the settings menu, press and hold the + and - buttons on the handlebar remote.
Altitude (alt)
You can view your current altitude from sea level (meters or feet), altitude gain, or altitude descent. The display measures altitude through a pressure sensor. The display will show this as "alt" on the TCU or "ALT" on the TCD.
For best results, calibrate the altitude before you ride through one of these methods:
- Use the remote to enter the setup menu (simultaneous long double press of +/- on the remote) and calibrate the elevation manually with the remote buttons. You need to know your current altitude.
- In Mission Control (2.8.0 and later), go to the "My Bikes" menu and select "Calibrate Bike To Phone Elevation." The phone needs to have a barometric sensor to use this function. Accuracy depends on the phone sensor.
Altitude gain and descent (alt gain and alt desc)
Displays the relative vertical distance a rider gained or lost since resetting the field to 0. Data is cumulative. These metric fields are limited to 4 characters, meaning 9999 (ft or m) is the maximum value.
Unit: meters or feet
To see data for a particular ride, zero altitude gain before starting a new ride (long press on minus-button of remote). Note that all other resettable data will be zeroed as well.
Cadence (cad)
Cadence displays the amount of crank revolutions per minute (rpm = revolutions per minute). The display will show this as "cad."
The display measures cadence through a sensor in the motor. You can also display cadence on ANT+ devices by connecting to the motor sensor through the display. To do this, use the display setup menu (simultaneous long press of +/- buttons).
Try to pedal at cadences of 75+ rpm for best efficiency, range, and motor support.
Average cadence and maximum cadence (avg cad and max cad)
You can see your average and maximum cadence for a ride. To see data for your next ride, reset your display before you start (long press on minus-button of remote). Note that this resets all ride data.
Clock
The clock shows the time of day in hours and minutes (12h or 24h). You can manually set the clock using the display setup menu (simultaneous long press of +/- remote buttons). A display reset makes the clock default to a certain value (e.g., 2:00 pm).
Total time (tot time)
Shows the total time, including riding time and stopped time. Charging the bike battery stops the timer.
Stopped time (stop time)
Shows the time the bike was not moving since resetting the field to 0. Stopped time includes whenever the bike speed is less than 3 kph (1.86 mph). Charging the bike battery stops the timer.
Riding time (ride time)
Shows the time the bike was moving since resetting the field to 0. Riding time includes whenever the bike speed is more than 3 kph (1.86 mph). Charging the bike battery stops the timer.
Diagnose
The diagnose menu items include battery level, battery consumption, and the current slope (gradient).
Battery level (batt)
Shows the current charge level in percentage of battery charge remaining.
The color turns orange or red to indicate low state of charge at 15-20% remaining. When this happens, the system begins reducing motor power.
Consumption (avg cons)
Shows the battery consumption in watt hours per kilometer or mile. The higher the number, the larger the consumption.
Slope (slope)
Shows the percent gradient (positive or negative) of the current surface the bike is moving on. Rolling changes in altitude are used to calculate the slope. Slope measurements will have a slight delay since a rolling average is used.
AXS Battery Level (RD battery)
Note: this requires MasterMind TCU firmware 31.C.0. or higher and the latest Mission Control version.It is important to follow these exact steps to display AXS information on the MasterMind display.Before you start the process, ensure the MasterMind TCU and AXS derailleur run on the latest firmware. Update through Mission Control and/or AXS app.
- Turn on bike
- Make sure AXS components are awake by gently shaking the bike (confirm by shifting up and down)
- Enter setup menu of MasterMind display (keep +/- buttons on remote pressed)
- Navigate to: Sensors / Pair ANT / Shifting
- Confirm “Shifting” with F1 remote button
- Make sure pairing to AXS is confirmed on MasterMind display
- Open Mission Control and connect to bike
- Go to TUNE and CUSTOMIZE DISPLAY
- Create AXS display field to see AXS data on MasterMind display
Tips in case pairing fails:
- Do NOT create the MC metric fields before pairing AXS sensors to MasterMind TCU
- Ensure all components are up-to-date, bike display and AXS
- Reduce the distance between the display and the AXS derailleur: Remove the MasterMind TCU from the frame, gently pull some cable and hold it as close as possible to the rear derailleur for pairing; when re-installing the display, only lightly tighten the TX10 screw (0.8 Nm max.)
- Run a factory reset for the MasterMind TCU by holding both plus and minus button of the remote down for 45 seconds; the display will reboot twice. Re-attempt pairing. Note for Mission Control: before re-pairing to Mission Control, you need to remove the bike from the Bluetooth device list in your phone.
Rear derailleur charge levels as displayed on MasterMind unit.
The display converts messages from shift system into these 6 charge level indications:
100%
75%
50%
25%
5%
AXS Gear (rear gear)
Note: this requires MasterMind TCU firmware 31.C.0. or higher and the latest Mission Control version.
Shows the current rear gear.
Heart Rate
Heart rate (hr)
Shows your current heart rate in bpm (beats per minute) if a Bluetooth or ANT+ heart rate belt is connected to the system.
To pair a heart rate belt, enter the display setup menu (simultaneous long double press of +/- remote buttons) and select sensors.
Average heart rate (avg hr)
Shows the mean value of all heart rate readings during your ride if a Bluetooth or ANT+ heart rate belt is connected to the system.
Jump Stats
*Note that Jump Stats is only available for 2022 or newer Levo, Kenevo SL, and Kenevo models with MasterMind TCU. You must have the latest version of Mission Control and the latest MasterMind TCU firmware, which you can verify under Diagnose in Mission Control.
Beginning July 19, 2022, you can record jump data on the Mission Control app and see it displayed after each jump on the bike's MasterMind TCU display. The MasterMind TCU features an accelerometer to estimate jump data. These metrics need to be reset to zero manually before the next ride (long press on the remote minus button)
Jumps
Estimates the number of times jumped.
Last jump distance (last jump dst)
Estimates the last jump distance traveled through the air in meters, based on the horizontal take-off speed.
Last jump duration (Last jump dur)
Estimates the time in the air (seconds) of the last jump.
Power
Rider power (rider pow)
Displays the current power output of the rider in watts.
Rider power is measured through a sensor in the motor and can also be displayed on ANT+ devices by connecting to the motor sensor through the display; to connect an ANT+ device, use the display setup menu (simultaneous long press of +/- buttons).
Motor power electric (mot pow el)
The battery output (watts) delivered to the bike, including peripherals such as lights.
Motor power mechanical (mot pow mech)
Estimated as 80% of battery output power, since no motor reaches 100% efficiency.
Total power (tot pow)
The sum of rider power and mechanical motor power in watts.
Average total power (avg tot pow)
This is the average for motor power and rider power together, calculated over ride time.
Power ratio (pow ratio)
Power ratio represents "x times you" expressed in numbers. It is calculated by dividing mechanical motor power by rider power.
Example: 167 / 48 = 3.5; this means the motor adds 3.5 times the rider input.
The higher the power ratio value, the more motor support a rider gets from the system and vice versa.
Note that this a rough indication since mechanical motor power is estimated as 80% of battery output power, which is displayed as the electrical motor power (mot pow el).
Range
Estimated range (est range) and range trend (range trend)
Range estimation is calculated using consumption over past ride intervals and battery capacity at the point of calculation. Since this estimation is based on past data, your actual range may be much greater or less if your future riding will be significantly different (all uphill vs. downhill).
Both "Estimated Range" and "Range Trend" update every 20 m while the bike is moving. The long range estimate is based on a rolling 50 km window of past riding; the range trend indicator is the long range estimate compared to a rolling window of 400 m.
Switching/changing support modes does not instantaneously update values for remaining range – you need to do some riding before seeing updated values; similar to changing gear in a car.
The range trend shows the impact the current riding is having on the range estimate - use this as an indicator for how reliable the range estimate will be if one continues with the current riding style.
Ride
Motor odometer (odo)
Displays the total distance ridden in kilometers or miles.
Motor odometer values are saved within the motor unit and cannot be reset.
Ride distance (dist)
Displays the distance ridden, in kilometers or miles, since the last display reset.
To see data for a particular ride, zero distance before starting a new ride (long press on minus button of remote).
Current motor support (inf tune)
Displays the current Support and Peak Power settings as defined per Mission Control or Infinite Tune. Example 35 / 70 = 35% Support and 70% Peak Power
Assist mode (mode)
Shows the current mode: TURBO, TRAIL/SPORT, ECO, OFF, MICRO TUNE, SMART CONTROL, WALK ASSIST
Calories (kcal)
Calculates the approximate total kilocalorie consumption of the rider, as calculated from the sum of rider power for the ride.
For the calculation, the system uses 1 kilocalorie (kcal) equals 4.184 Joules (J) and human efficiency of 25% such that Energy (kcal) = Power (watts) * Time (hours) * 3.6
Gear ratio (gear)
For the MasterMind TCD only, this is a feature for bikes equipped with enviolo AUTOMATiQ internal gear hubs. The colored bar on the graph will change according to the current gear ratio and show when you have reached the limits.
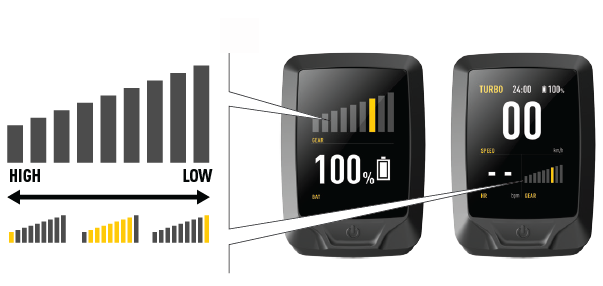
Note that enviolo AUTOMATiQ internal gear hubs do not have an unlimited gear ratio and have upper and lower limits. Once these limits have been reached, the bicycle will require more or less effort to pedal depending on the gradient. When the gradient is too steep, the motor support and the enviolo IGH may not be able to support your desired pedal pace.
Speed
Displays your current speed in kph or mph.
Speed is calculated using the speed sensor system of the bike and the wheel circumference stored in the motor. Authorized Specialized retailers can adjust the wheel circumference within a certain legal limit to accommodate for different wheel and tire options.
Average speed (avg spd)
Shows the mean speed in kph or mph since the last display reset. It is calculated by distance traveled divided by time taken.
To see data for a particular ride, zero average speed before starting a new ride (long press on minus-button of remote).
Maximum speed (max spd)
Shows the maximum speed in kph or mph since the last display reset.
To see data for a particular ride, zero max. speed before starting a new ride (long press on minus-button of remote).